
Is East River Co-op moving slower than its neighbors?
20 Years, 4 Co-ops, & 10002: Update
On a recent walk home from school drop-off — my typical means of transit for this particular chore — I decided to reach out to my friend, Artsy Darcy.
Darcy is a portrait artist and neighbor whom I've gotten to know over the years. We talk about life on the Lower East Side and parenthood, but I’m most intrigued by the stories about the people behind her portraits.
For some time, I'd been meaning to inquire about a particular painting of hers that I'd seen in her portfolio. It was a portrait of someone from the neighborhood, someone recognizable, someone whose path occasionally intersected with mine and my children's. She wasn’t someone we knew intimately, but she was a remarkable and highly recognizable character nonetheless. I wanted to know if the painting was still available for sale.
It wasn’t.
I wasn't particularly surprised. In fact, I was very late to the art party. The painting had sold several years ago. We then turned to real estate.
Darcy told me that she'd decided to move to an outer borough, renting out her apartment at East River Cooperative and relocating to a neighborhood where she could have more space to paint, room to explore her subjects, and some additional disposable income to support her lifestyle.
The decision itself wasn't surprising. We'd discussed the possibility over coffee months earlier. What surprised me was that she'd actually done it.
Naturally, we discussed the possibility of selling her apartment instead. That suggestion was met with a speculative observation about the perceived inertia of apartment sales at East River Cooperative.
It was an interesting comment, and one that I parked on a shelf until later that day, when I sat down to investigate.
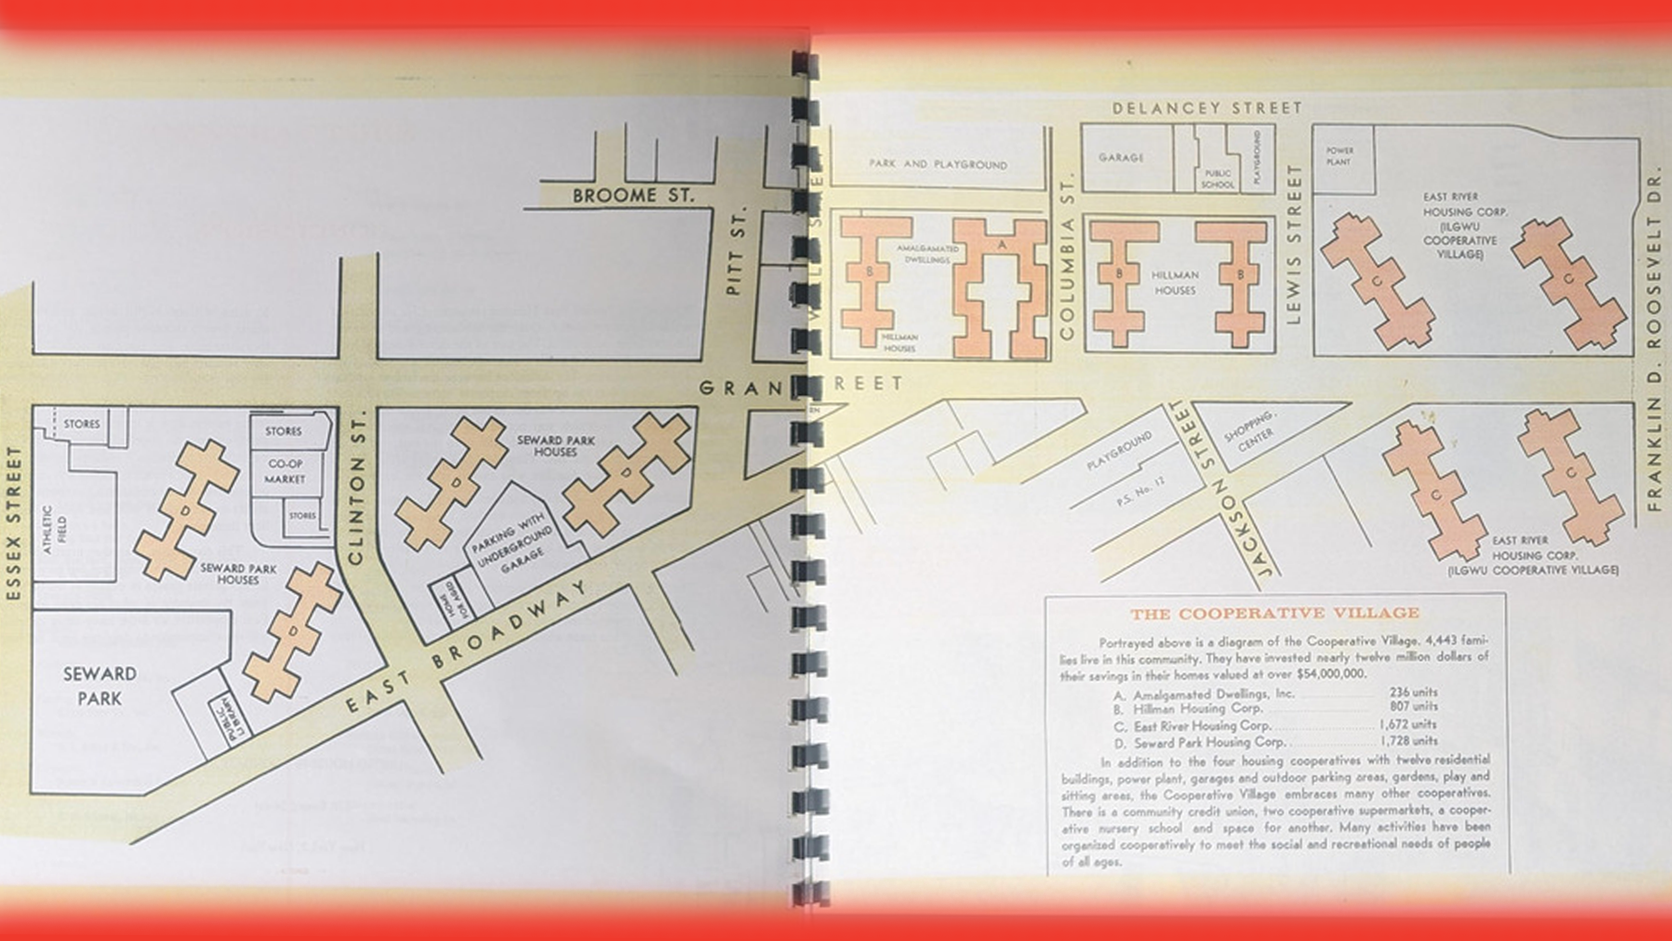
I posed the question: Are apartments at East River Cooperative moving at a demonstrably slower pace than those at its neighboring cooperatives — Seward Park, Hillman, and Amalgamated?
The available data suggested there might be something to her observation.
A little history
Readers familiar with More For LES' report, 20 Years, 4 Co-ops, & 10002, will recall our research into the cooperatives of ZIP code 10002, including their histories, apartment values, and the characteristics that distinguish one from another.
This, however, was different. It marked the first time we approached the question from the perspective of comparative transaction activity.
To do so, we examined 2,173 historical listing records across East River Cooperative, Seward Park Cooperative, Hillman Housing Cooperative, and Amalgamated Housing Cooperative, dating back to 2005.
Our research relies on transaction histories available through StreetEasy (and, if you’re a licensed real estate professional in New York, you likely know that this relationship is “complicated”). The available records distinguish between sales with recorded closing information, reported sales without corresponding closing documentation available on the platform, and listings removed from the market without a confirmed sale.
It's an important distinction. The absence of a recorded closing on StreetEasy doesn't necessarily mean a sale didn't occur, just as a listing being removed from the market doesn't necessarily mean the owner was unable to find a buyer.
Effectively, we're limited by what the available records tell us.
To keep our analysis focused on what the data tells us, More For LES won't speculate about the reasons behind any differences we identify. That includes ongoing litigation, changes in cooperative policies, board composition, or broader market factors.
Our objective is narrower: to determine whether the transaction data itself reveals a measurable difference in sales activity.
Twenty years of transactions
We began by organizing the records into historical periods, first examining 2005 through 2009, then 2010 through 2019, and finally the period beginning in 2020.
The earlier records provide context, although historical coverage is less comprehensive and comparisons must be treated accordingly.
Between 2005 and 2009, we identified 213 recorded or reported sales across the four cooperatives, including 92 confirmed closings. This is how the sales broke down:
- East River: 83 sales
- Seward Park: 70 sales
- Hillman: 49 sales
- Amalgamated: 11 sales
During the following decade, from 2010 through 2019, the available records identified 996 sales, including 288 confirmed closings. This is how the sales broke down:
- East River: 423 sales
- Seward Park: 323 sales
- Hillman: 194 sales
- Amalgamated: 56 sales
Beginning in 2020, the available records provide a more useful picture of recent activity.
From January 2020 through mid-October 2026, the available records identified 683 recorded or reported sales across the four cooperatives. This is how the sales broke down:
- East River: 250 sales
- Seward Park: 222 sales
- Hillman: 158 sales
- Amalgamated: 53 sales
These figures establish a useful historical backdrop, but they don't necessarily tell us whether one cooperative is performing better than another. The communities differ in size, and the number of apartments changing hands will naturally vary.
To get to the bottom of our question, we need to look more closely at recent activity, particularly what has happened between 2025 and 2026.
A tale of two years
Because 2026 is still underway, comparing its activity with the entirety of 2025 would be misleading. Instead, we examined the equivalent January 1 through October 14 periods in both years.
In 2025, the four cooperatives collectively accounted for 101 listing outcomes between January 1 and October 14. Of those, 89 were recorded or reported sales, including 17 confirmed closings. The remaining 12 listings were removed from the market without a confirmed sale.
This is how the activity broke down, with percentages reflecting the share of observed listing outcomes classified as sales:
- East River: 46 listings, 39 sales, nine confirmed closings, seven off-market (85% sold)
- Seward Park: 25 listings, 23 sales, two confirmed closings, two off-market (92% sold)
- Hillman: 22 listings, 20 sales, four confirmed closings, two off-market (91% sold)
- Amalgamated: Eight listings, seven sales, two confirmed closings, one off-market (88% sold)
Collectively, approximately 88% of the observed listing outcomes across the four cooperatives were classified as sales.
Now, let's consider 2026.
Through October 14, we identified 97 listing outcomes across the same four cooperatives, only four fewer than during the equivalent period in 2025.
On the surface, that might suggest a relatively stable market.
But the composition of those records tells a different story. Of the 97 outcomes, only 64 were recorded or reported sales, including ten confirmed closings. The remaining 33 listings were removed from the market without a confirmed sale.
This is how the activity broke down, using the same classifications:
- East River: 38 listings, 16 sales, two confirmed closings, 22 off-market (42% sold)
- Seward Park: 36 listings, 32 sales, four confirmed closings, four off-market (89% sold)
- Hillman: 17 listings, 11 sales, two confirmed closings, six off-market (65% sold)
- Amalgamated: Six listings, five sales, two confirmed closings, one off-market (83% sold)
Collectively, approximately 66% of the observed listing outcomes across the four cooperatives were classified as sales, compared with 88% during the equivalent period in 2025.
That's a decline of approximately 28% in recorded and reported sales, while the number of listings removed without a confirmed sale increased by 175%.
Returning to our original question, the available data suggests that East River is experiencing a more pronounced slowdown in reported sales activity than its neighbors.
But just how significant is that difference?
East River versus the neighbors
At East River, the number of recorded or reported sales declined from 39 during the comparable 2025 period to just 16 in 2026.
That's a decline of approximately 59%.
Of those 16 sales in 2026, only two had confirmed closing records available in our dataset. Meanwhile, the number of listings removed from the market without a confirmed sale increased from seven to 22. Put another way, approximately 85% of East River's observed listing outcomes were classified as sales in 2025. In 2026, that figure fell to approximately 42%.
Woof. That's a substantial change.
But what's particularly noteworthy is what happened immediately next door. During the same period, the other three cooperatives recorded the following changes:
- Seward Park: Sales increased from 23 to 32 (up 39%), while off-market listings increased from two to four.
- Hillman: Sales declined from 20 to 11 (down 45%), while off-market listings increased from two to six.
- Amalgamated: Sales declined from seven to five (down 29%), while off-market listings remained unchanged at one.
Across the four cooperatives, East River experienced the largest percentage decline in recorded and reported sales, while Seward Park, immediately next door, experienced an increase. That distinction deserves attention.
What the numbers tell us (and what they don't)
There are limitations to what we can conclude from this analysis.
For one, transaction volume is not the same thing as the speed at which an individual apartment sells. To determine that, we'd need to examine listing dates, days on market, contract dates, and other information beyond the scope of this particular study. Similarly, the number of listings removed without a confirmed sale doesn't establish that those apartments failed to attract buyers. Some may have been withdrawn voluntarily, relisted, rented, or sold through transactions not reflected in the available records.
And because the cooperatives differ in size, comparing raw transaction counts isn't the same as calculating the percentage of each cooperative's housing stock that changes hands annually. What we can measure, however, is the change in reported transaction activity within each cooperative over equivalent periods. And on that basis, the results are difficult to ignore.
East River's recorded and reported sales declined approximately 59% in 2026, compared with the equivalent period in 2025. Hillman declined 45%, Amalgamated declined 29%, and Seward Park increased 39%.
Back to Darcy
Darcy's decision to rent rather than sell was ultimately a personal one, informed by her circumstances, priorities, and the flexibility that retaining ownership provides. But her anecdotal observation about the East River sales market raised a question worth investigating — one that the available data helps answer.
East River has experienced a substantially greater decline in reported sales than its neighbors, particularly Seward Park, where sales have actually increased.
Does that mean an apartment at East River is inherently more difficult to sell? Not necessarily. Does it mean shareholders should reconsider selling? No to that, either.
What it does mean is that the performance of one cooperative shouldn't be assumed to reflect that of another, even when the buildings are separated by little more than a street.
For shareholders considering whether to sell, rent, or remain in their homes, understanding what's happening within their own cooperative is every bit as important as understanding the broader real estate market.
As for Darcy, I wish her well in her new surroundings, with more room to paint and the freedom to pursue whatever subjects capture her imagination. And when she's ready to return to the Lower East Side or put her apartment on the market, I'll be here, ready to welcome her back or lend a hand.
Footnote: Research methodology and data limitations
This analysis was prepared by More For LES using 2,173 historical listing records obtained from StreetEasy for East River Cooperative, Seward Park Cooperative, Hillman Housing Cooperative, and Amalgamated Housing Cooperative, covering December 6, 2005, through October 14, 2026.
Records were categorized according to their reported status: recorded sales with closing information available, reported sales without corresponding closing documentation available in the dataset, and listings designated as no longer available without a confirmed sale. Recorded and reported sales were combined for purposes of measuring transaction activity; confirmed closings are included within, rather than added to, those sales totals.
Year-over-year comparisons use equivalent periods of January 1 through October 14 in 2025 and 2026. Percentages described as “sold” represent the proportion of observed listing outcomes classified as recorded or reported sales, rather than a verified sale-to-listing conversion rate. Percentage changes are calculated from the underlying record counts and rounded.
The analysis measures reported transaction activity, not individual apartment marketing times, contract execution dates, or sales as a percentage of total cooperative housing stock. Listings removed from the market may have been withdrawn, rented, relisted, or sold through transactions not reflected in the available records. Individual apartments may also appear in multiple records over time. Historical reporting coverage may vary, particularly in earlier years.
Accordingly, these findings should be interpreted as a comparative analysis of available listing and transaction records, not a comprehensive accounting of all completed sales or a determination of the reasons for differences in market activity. The information reflects the dataset as of October 14, 2026, and may change as additional transactions are reported or recorded.